

From ingestion to insight: a fully owned data path that, minimizes cost at scale and exposes opportunities and risk and drives action.
Every modern cloud system produces an endless stream of signals — logs, metrics, traces, events — and observability is what turns that noise into understanding. It’s not optional anymore; it’s the only way to see how a distributed platform behaves under real load, across real regions, with real users. AWS gives you CloudWatch as the baseline: a place to collect logs, visualize metrics, set alarms, and trace requests through your stack. And in a single region or a single cluster, it does that job well.
But the moment your architecture spans multiple regions or multiple clusters, the cracks start to show…
CloudWatch Is Great — Until You Go Multi‑Region
CloudWatch is a perfectly capable observability platform when you’re operating in a single region or a single cluster. But the moment your architecture spans multiple regions, multiple accounts, or multiple elastic clusters, the experience breaks down fast. Logs and metrics become scattered across regional silos, dashboards fragment, alarms lose global context and troubleshooting turns into a scavenger hunt. An error that originates in one region may surface as symptoms in another, yet CloudWatch gives you no native, unified way to correlate those signals. The result is a system where the data exists, but the insight doesn’t — and engineers waste time pivoting between consoles, accounts, and regions just to answer basic questions like “Where is this failing?” or “Is this a regional issue or a global one?”
This is exactly the gap vendors like Datadog, New Relic, Dynatrace, and Honeycomb are built to fill. They give you what CloudWatch doesn’t: a single pane of glass across regions, accounts, clusters, and services. They correlate logs, metrics, and traces automatically. They make cross‑regional debugging almost pleasant. And they absolutely know what that’s worth. The pricing models are scaled with ingestion, retention, and cardinality — which means the moment your platform grows, your observability bill grows faster. For multi‑region architectures, it’s not unusual for these tools to become one of the top three-line items in your cloud spend. They solve the problem, but they do it at a premium that forces most teams to rethink what “good enough” observability really means.
🏗️ The Goal: A Multi‑Region Data Lake for Metrics and Errors
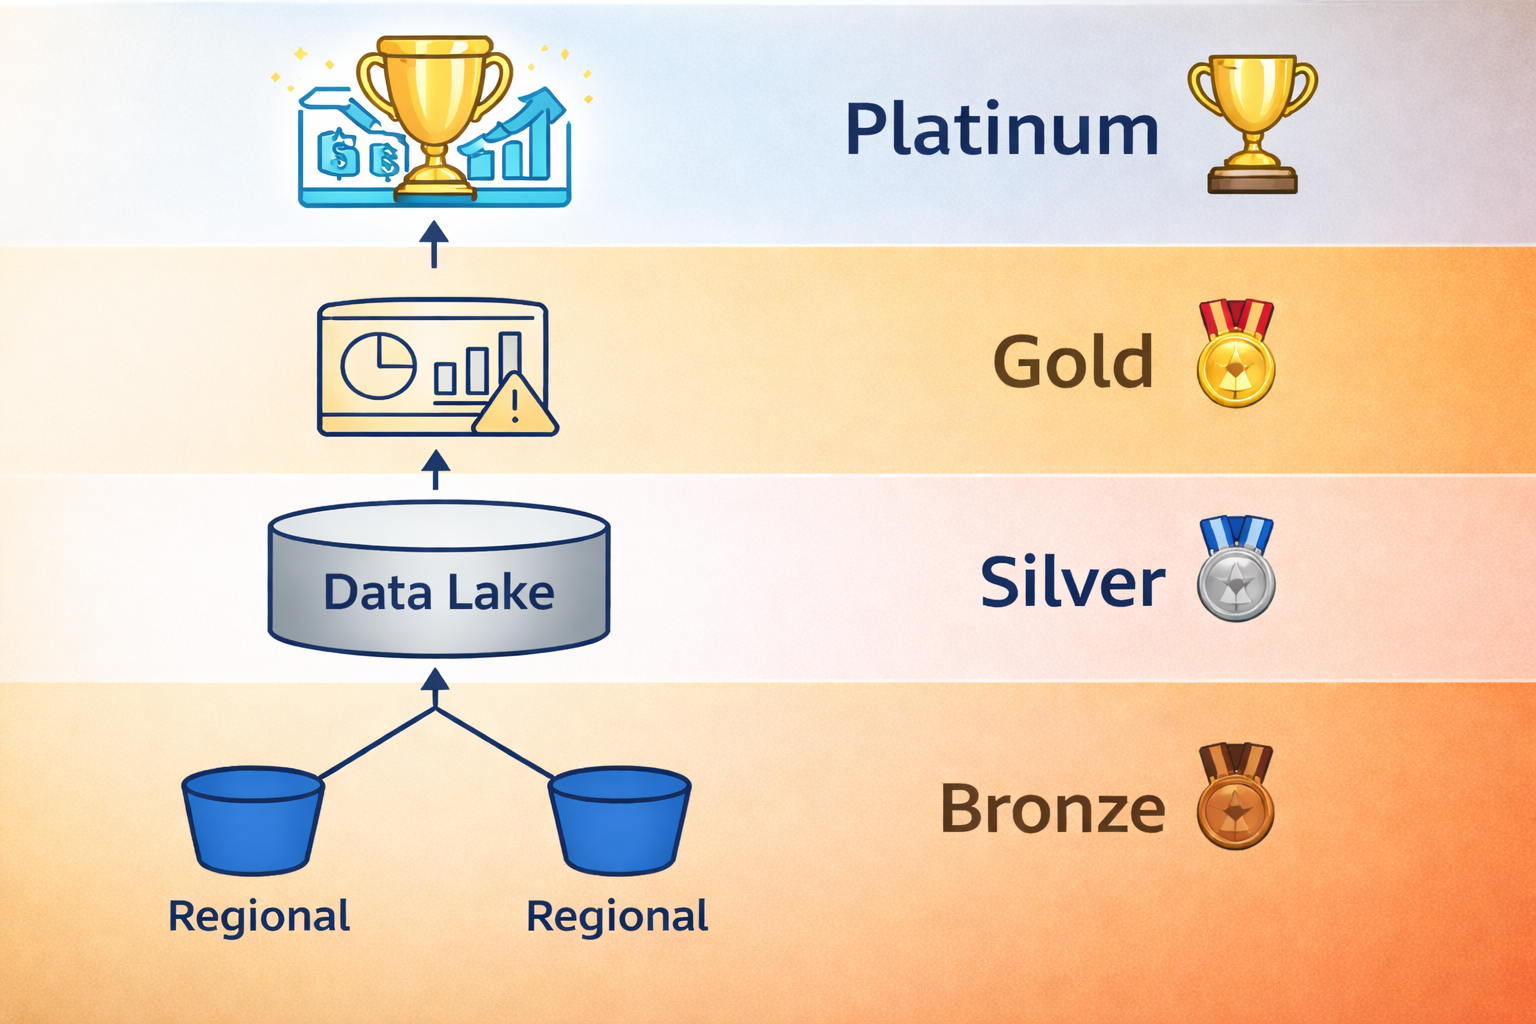
The entire purpose of this design is simple: build a centralized, queryable data lake that contains all metrics and all error signals from every region, without paying Datadog‑level ingestion costs. To get there, you treat observability data like any other analytics pipeline — structured into bronze, silver, and gold layers that progressively clean, normalize, and optimize the data. Finally, a platinum layer gives you actionable business intelligence and allows you to measure your progress over time.
Near‑Real‑Time Observability Across Regions
Provide engineers with end‑to‑end visibility of metrics and errors from every region with minimal latency, ensuring operational teams can detect, correlate, and respond to issues almost as soon as they occur. The ingestion‑to‑query delay is measured in seconds or low tens of seconds, not minutes.
Low‑Cost, Cloud‑Native Ingestion and Storage
Eliminate the steep ingestion and retention fees common in commercial observability platforms by using S3‑based landing zones, Parquet optimization, and lightweight processing. Costs scale linearly with storage and compute—not with cardinality or event volume—making the architecture dramatically cheaper at scale.
Endless Scalability Through Layered Data Design
Support unlimited growth in regions, services, traffic volume, and metric cardinality. The architecture scales horizontally because each region writes locally, replication is asynchronous, and analytics sit on top of columnar storage that handles massive datasets without performance cliffs.
Centralized, High‑Fidelity Insight Without Vendor Lock‑In
Maintain all observability data in your own buckets with your own schemas, ensuring complete ownership, flexibility, and portability while still enabling enterprise‑grade analytics and correlation across regions.
Foundation for Advanced KPIs
Enable higher‑order business insights—such as degradation indices, error‑traffic ratios, and customer‑impact scores—by aggregating clean, consistent data across the pipeline.
🥉 Bronze Layer — Raw Regional Ingestion -> Central Ingestion
This layer captures everything as it happens in each region. Nothing fancy, just reliable, cheap, append‑only storage.
- CloudWatch Metric Filters → Regional S3 (raw metrics)
Extract structured metric events from CloudWatch logs and write them directly into an S3 bucket in the same region. These are unprocessed and timestamped metric events. - CloudWatch Subscription Filters → Regional S3 (raw errors)
Stream error logs, warnings, anomalies, and timeouts into the same regional S3 bucket. Again: raw, unmodified, high‑fidelity signals. - Regional S3 buckets as isolated landing zones
Each region owns its own import bucket. This avoids cross‑region transfer costs and ensures ingestion continues even if another region is degraded.
Once each region has its own raw Bronze‑layer landing zone, those buckets replicate into a single central observability bucket in your monitoring account. Replication happens once per object, keeping cross‑region transfer costs predictable and minimal. Each region writes into its own region‑scoped prefix (for example: us-east-1/, eu-west-1/, ap-southeast-2/) to avoid naming collisions and to preserve clean lineage for downstream processing. The regional buckets also enforce simple lifecycle rules—typically “expire raw objects after N days”—so they continuously clean themselves up without operational overhead. The result is a steady, low‑friction flow of raw metrics and errors from every region into a single, centralized S3 bucket ready for Silver‑layer normalization.
Outcome: You now have all metrics and all errors captured region‑by‑region in raw form.
🥈 Silver Layer — Central Aggregation & Normalization
This layer consolidates the raw regional data into a single account and applies lightweight cleanup.
- Cross‑region replication or batch aggregation
Regional Bronze buckets replicate or batch‑transfer their raw data into a central S3 bucket in your observability account. - Normalization jobs (Lambda, Glue, Step Functions)
A simple processing layer cleans up timestamps, enforces schema consistency, and removes noise.
Think: “make the data usable, but don’t over‑transform it.” - Convert raw JSON/CSV → Parquet
This is the big win. Parquet gives you columnar compression, cheap scans, and fast queries.
Outcome: You now have a unified, normalized, cost‑efficient dataset ready for analytics.
🥇 Gold Layer — Query‑Ready Observability Lake
This is the polished, analytics‑friendly layer that powers dashboards, investigations, and long‑term insights.
- Partitioned, optimized Parquet datasets
Partition by region, date, service, or error type — whatever makes sense for your query patterns. - Athena, QuickSight, OpenSearch, Grafana or custom dashboards
The Gold layer becomes your single source of truth for multi‑region observability.
You can build global dashboards, run ad‑hoc queries, or feed the data into downstream systems. - Correlated metrics + errors across regions
The real payoff: you can finally answer questions like
“Did this spike start in us‑east‑1 or eu‑west‑1?”
“Are these errors isolated or global?”
“Which services are degrading together?”
Outcome: A true multi‑region observability surface — fast, cheap, centralized, and fully under your control.
🏆 Platinum Layer — KPI Synthesis & Business‑Level Risk Signals
The Platinum layer transforms aggregated Gold‑layer datasets into business‑aligned KPIs that expose operational risk, customer impact, and priority actions. This is where raw signals become decision‑grade insights. Platinum jobs compute composite indicators (e.g., error‑to‑traffic ratios, latency‑weighted risk scores, region‑level degradation indices) derived from normalized, multi‑region data. These KPIs are curated, versioned, and published as actionable datapoints that allow engineering, product, and leadership teams to measure business risk, track trends, and immediately identify where attention is required. The Platinum layer is intentionally small, opinionated, and high‑value — it represents the distilled truth of system health and business exposure.
🛠️ Rolling Your Own Observability Pipeline — Pros & Cons
✅ Pros — Why Teams Choose to Build Their Own
- Full control over data shape, retention, and semantics – You decide what gets captured, how it’s structured, and how long it lives. No vendor‑imposed schemas, sampling, or black‑box transformations.
- Cost transparency and cost leverage – You pay for S3, compute, and glue logic — not per‑metric, per‑event, or per‑GB ingestion premiums. For high‑volume systems, this is often an order‑of‑magnitude cheaper.
- Multi‑region by design – You can architect ingestion, replication, and aggregation exactly the way your topology demands, not the way a vendor’s control plane happens to work.
- Vendor independence – Your metrics, logs, and KPIs live in your buckets, in your formats, under your lifecycle rules. Switching tools or layering new analytics becomes trivial.
- Opinionated KPIs that match your business – Platinum‑layer KPIs can reflect your risk model, not a generic dashboard template. You get insights that drive decisions.
- Composable, evolvable architecture – Each layer (Bronze → Silver → Gold → Platinum) can be swapped, tuned, or extended without rewriting the entire pipeline.
⚠️ Cons — What You Take On When You Build It Yourself
- You own the plumbing – S3 replication, lifecycle rules, schema evolution, partitioning, compaction, and job orchestration all become your responsibility.
- You need engineering discipline – Without clear contracts between layers, the pipeline can drift into chaos. Schema drift, inconsistent timestamps, and missing fields become your problem to solve.
- You must build your own guardrails – Alerting on ingestion failures, monitoring replication lag, validating data quality — these don’t come for free.
- Long‑term maintenance is real – Even simple pipelines accumulate complexity over time: new regions, new services, new KPIs, new compliance requirements.
- You don’t get dashboards “for free” – Visualization, correlation, and exploration layers must be built or integrated. A raw data lake doesn’t magically become a polished observability product.
- Requires cross‑team alignment – If product, SRE, and engineering aren’t aligned on what “good signals” look like, the pipeline becomes a dumping ground instead of a decision engine.
Summary
Modern distributed cloud systems generate massive volumes of logs, metrics, traces, and events — and observability is what turns that raw noise into actionable insight. While AWS CloudWatch works well in a single‑region environment, it breaks down in multi‑region, multi‑account, or multi‑cluster architectures, leading to fragmented data, siloed dashboards, and difficult cross‑regional debugging. Third‑party platforms like Datadog, New Relic, Dynatrace, and Honeycomb solve these challenges but at a significant and rapidly scaling cost.
This architecture provides a fully owned, cloud‑native observability pipeline that delivers near‑real‑time visibility, extremely low operational cost, and virtually unlimited scalability. By structuring metrics and error ingestion into Bronze, Silver, and Gold layers—with a centralized data lake at the core—the platform eliminates the regional fragmentation and high ingestion fees associated with traditional third‑party vendors. The design allows signals from every region to be captured, consolidated, and queried with minimal delay while scaling effortlessly as traffic, regions, and services grow. The result is a unified, cost‑efficient, multi‑region observability surface that keeps pace with the demands of modern distributed systems.
The result is a unified, scalable, and deeply insightful observability platform — one that supports multiregional architectures without relying on expensive third‑party ingestion‑based pricing models.
Here’s the challenge: commit to invest in an observability foundation that delivers near‑real‑time insight, ultra‑low cost, and limitless scalability—so our platform can keep growing without ever losing clarity or control.